My journey with jPOS and elastic
Available in
This article was originally published on LinkedIn.
“If you cannot measure it, it doesn’t exist” is a very disputed idea and personally I agree with this article that affirms that this is no true, but I also consider that you can’t be blind on things that should be measured.
A few years ago, when I got involved with a jPOS based solution for financial transaction processing I was shocked to realize how both business and operational sides were almost blind on what was happening on real-time, only assisted by huge text files generated by jPOS logger. So, as a new kid moving to the financial technology neighborhood I tried to find a solution using lessons learned on my life journey as an aspiring entrepreneur temporally turned on a corporate clerk. One of these lessons is to avoid reinventing the wheel maximizing use of available building blocks, and better if these blocks are open source.
After looking around I decided that Graylog was a good way to start, so helped by docker and some python scripting I managed to start sending transactional events to Graylog where dashboards and alerts gave us immediate operational improvements. Once I got confidence with the solution I started to expand it gathering events from other sources. Later I found that Kibana was better to create impressive interactive dashboards and finally ended discarding Graylog and moving completely to the Elastic stack where using available building blocks (logstash, beats, whatcher, etc) infrastructure and transactional data can be searched, analyzed, alerted and visualized in real time by business, security and operational roles.
Despite I’ve been an advocate of open source since my college days, until now I’ve been a passively consumer of open source software and everything described on above paragraph was done privately and it is not available to share.
I feel that it is time to return something to community, so I invested nights and weekends to find a better standards based jPOS-elastic solution and I’m sharing here a summary of my results on this journey.
- Status data can be pulled from jPOS or pushed to elastic; by now I’m just pulling status data from jPOS at a defined time frequency.
- Transactional events should be pushed to elastic; still evaluating alternatives.
- Events can be sent directly from jPOS to elastic and it should be easy to use Elastic Java Client , but there’s a high value on using logstash for data enrichment.
Leverage already available JMX jPOS capabilities
https://github.com/andresantoniuk/jpos-elastic-demo/blob/master/metricbeat/modules.d/jolokia.yml https://github.com/andresantoniuk/jPOS-template/commit/79ac82997081df3a1539af4bcadbf7 fc 44c99f6b #diff-c197962302397baf3a4cc36463dce5eaR27 https://github.com/andresantoniuk/jPOS-template/commit/79ac82997081df3a1539af4bcadbf7 fc 44c99f6b #diff-bdfee8806ddb56da9c39c3b97751e55aR14 Logstash JMX Input plugin
https://github.com/andresantoniuk/jpos-elastic-demo/blob/master/logstash/conf.d/jmx.conf https://github.com/andresantoniuk/jPOS-template/commit/79ac82997081df3a1539af4bcadbf7 fc 44c99f6b #diff-bdfee8806ddb56da9c39c3b97751e55aR9
Use recently released jPOS-EE QRest Module
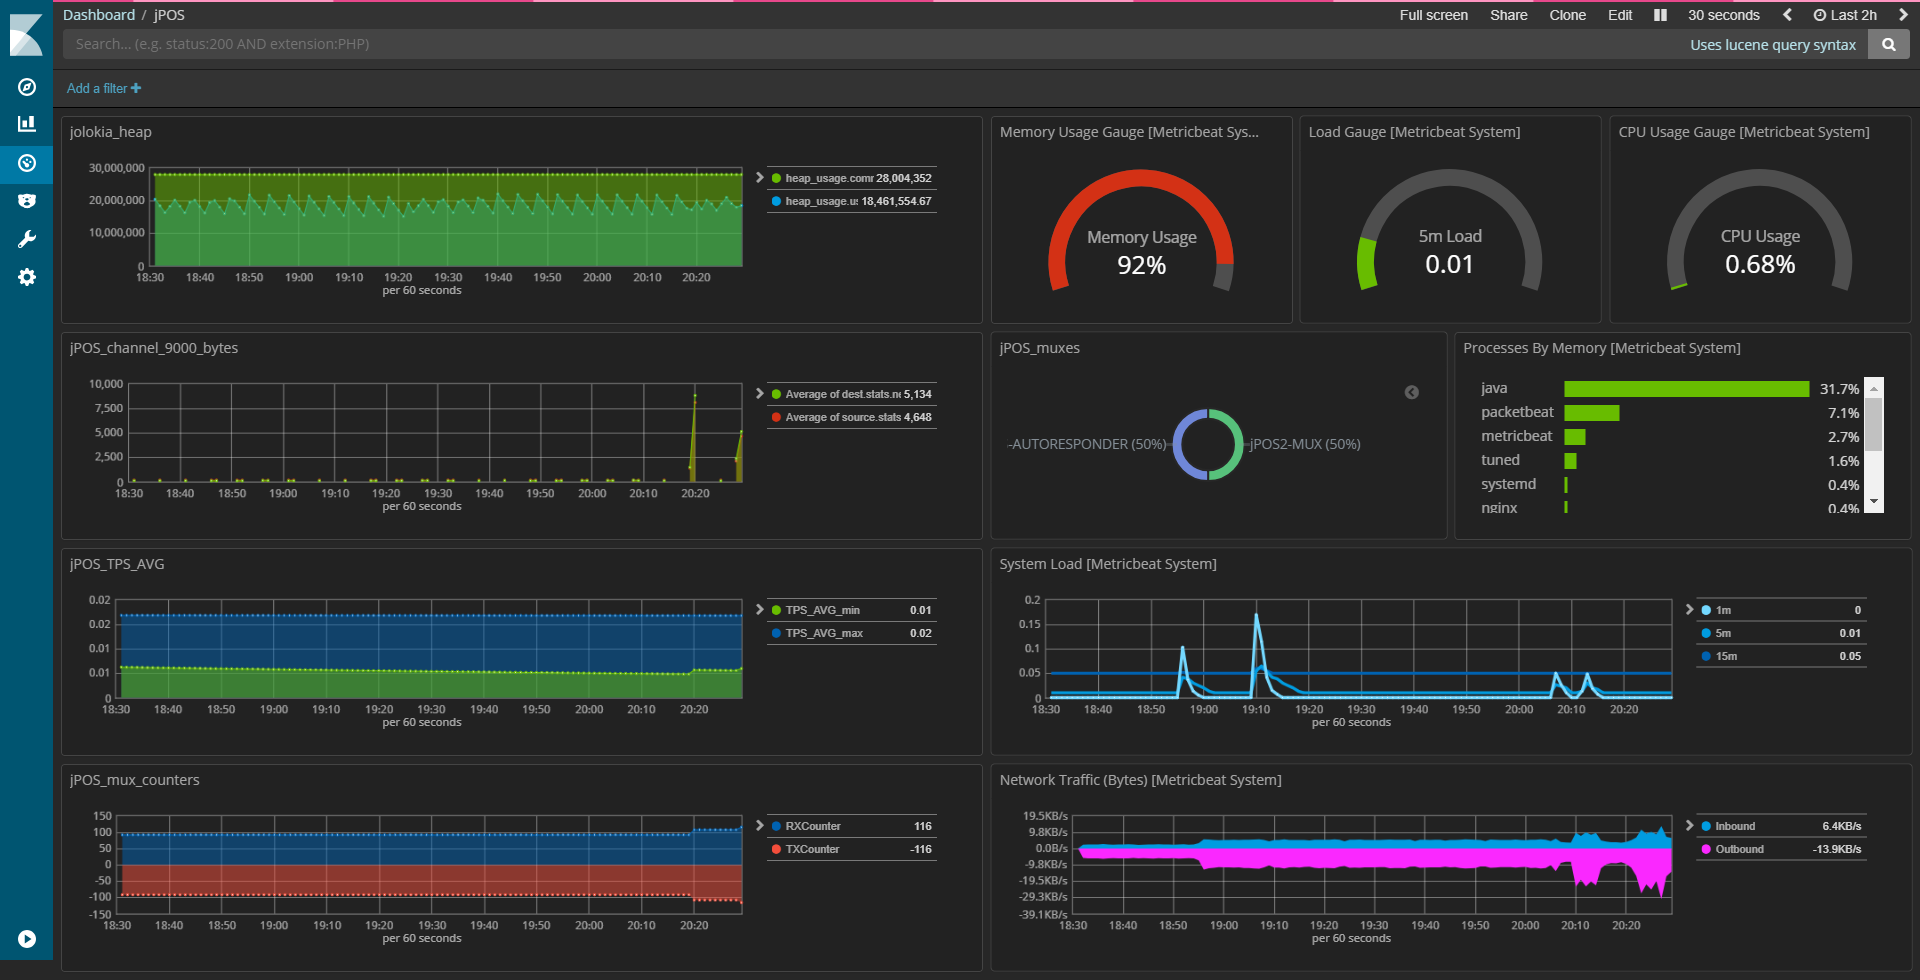
https: / /github.com/andresantoniuk/jpos-elastic-demo/blob/master/logstash/conf.d/qrest .conf Whit this configuration, based on the jPOS Gateway Tutorial interactive dashboards like the following can be easily created: